M&A Critique is the only magazine, published from India which gives News, Deals and Analysis of Merger & Acquisitions, Restructuring, Takeovers and Joint Ventures. M&A Critique gives unique insights and expert’s critique on middle market deals, Corporate Strategy for inorganic growth, Case study of deals, M&A Happenings in the High Court, M&A Digest, Legal insights and updates on the subject, content on leadership and much more.
Omkar Chemicals Demerger: What went wrong?
Get link
Facebook
X
Pinterest
Email
Other Apps
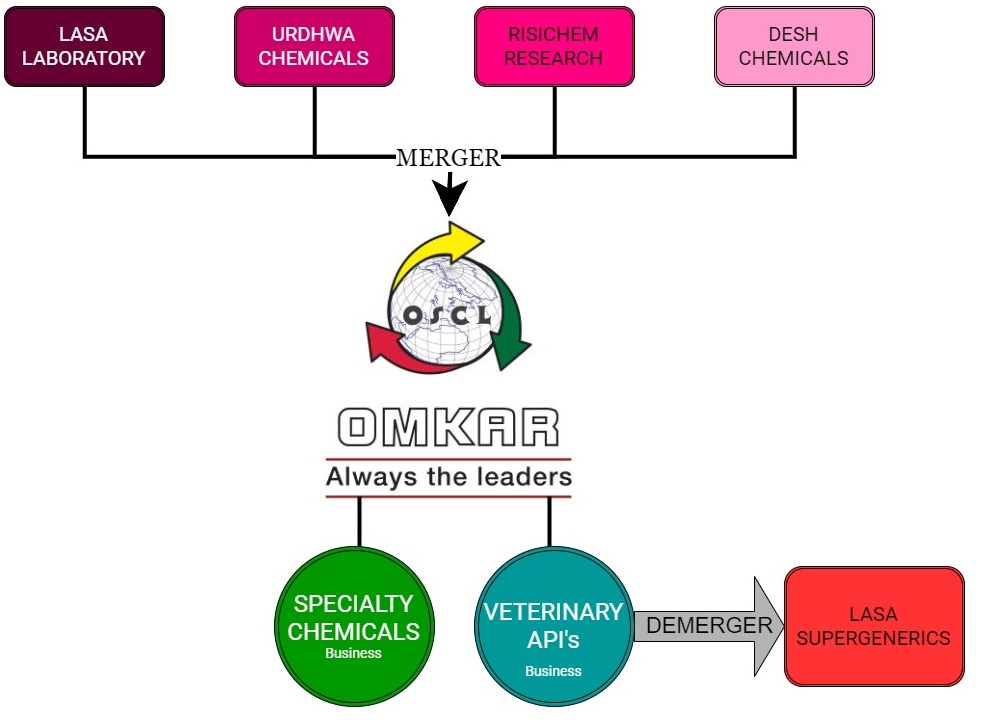
Demergers, which are expected to unlock shareholder value, have not worked in favour of shareholders of Omkar Speciality Chemicals and Lasa Supergenerics. Omkar Speciality Chemicals Limited (Omkar Chemical) incorporated in 2005, is in the business of speciality chemicals & active pharmaceutical ingredient (API). The business was carried out by Omkar Chemical on its own and through its 4 subsidiary companies. API business was carried out in the company’s subsidiary Lasa Laboratory Pvt Ltd (Lasa Lab).
Post demerger, Omkar chemical and Lasa Supergenre business collapsed and both the company facing liquidity challenges as well as potential Insolvency process threat. In this article, we analyzed the company’s financials from Mar-12 onward to understand what went wrong which lead to the current situation.
Transaction in 2015
Financial Analysis: Omkar Chemical
Table 1: Total Borrowings & Interest Cost (All Figs in INR Crores)
Particular
Mar-12
Mar-13
Mar-14
Mar-15
Mar-16
Mar- 17(3)
Mar-18
Mar-19
Banks
77.72
149.44
204.53
214.74
221.42
129.69
170.74
169.66
FI's
21.33
0.69
1.75
9.22
6.54
28.52
2.97
2.95
Sub-Total (A)
99.05
150.12
206.28
223.95
227.96
158.21
173.71
172.61
Loan from Related Parties / Directors (B)
0.20
0.71
0.19
0.00
0.09
60.14
59.00
56.89
Total (A -B)
99.25
150.84
206.47
223.95
228.05
218.35
232.72
229.50
Interest Exp(5) (incl. capitalised portion)
7.56
10.78
15.86
21.15
27.38
22.73
24.07
14.53
Other borrowing cost
0.46
0.07
0.72
1.59
1.52
0.81
2.06
0.09
Foreign currency Adj.
0.42
0.00
0.53
-0.08
0.00
0.00
Total Interest cost
8.45
10.85
17.11
22.66
28.90
23.54
26.13
25.71
Average Borrowings*
99.05
124.58
178.20
215.12
225.95
193.08
165.96
173.16
Avg. Int Rate
8.53%
8.71%
9.60%
10.53%
12.79%
12.19%
15.74%
14.85%
*excluding related party loan & closing balance for Mar-12 is considered as average borrowings for Mar-12
Borrowings and interest rates to services the loan have kept on increasing continuously from Rs. 99 crs (8.53%) in March-2012 to Rs 229.5 crs (14.85%) in March-2019.
In earlier years company was having ECB’s loan and later switched to domestic borrowing at a higher rate due to increase in foreign exchange.
There was a merger of subsidiary companies with Omkar and demerger of API division which was approved by the NCLT in April-17 and impact in financial was given in Mar-17, hence bank loan reduced from 221.42 crs to Rs. 129.69 crs in Mar-17, on account of transfer to API division.
Amount of loan reflecting in the Lasa Supergenres Ltd (API Division) as on Mar-17 is Rs. 119.75 crs
Loan from directors / related party does not carry any interest (as per Annual Report)
As on Mar-19, Omkar chemical has classified as NPA by all three banks, and total default (principal & interest) is Rs. 199 crs (approx.) as mentioned in the auditor’s report. Table 2: Assets & WIP Summary (All Figs in INR Crores)
Particulars
Mar-12
Mar-13
Mar-14
Mar-15
Mar-16
Mar-17*
Mar-18**
Mar-19
Tangible Assets
36.57
87.53
86.52
144.75
154.46
168.35
75.98
68.17
Total Intangible Assets
3.01
4.90
4.61
4.41
6.37
0.12
0.16
0.12
Capital Work in Progress
59.52
44.32
96.44
121.57
148.72
-
-
-
Total Assets
99.09
136.76
187.57
270.72
309.55
168.47
76.14
68.29
Operational Revenue
166.95
211.69
240.28
265.13
413.41
345.02
197.64
42.65
Tangible & Intangible Assets (excluding CWIP)
39.40
92.36
90.99
149.15
160.66
168.47
76.14
68.29
Asset Turnover Ratio
4.24
2.29
2.64
1.78
2.57
2.05
2.60
0.62
*It is a consolidated figure of omkar chemical excluding API division as per IGAAP **Omkar chemical figures are considering the impact of Ind-AS
Ind-AS adjustment effect: In Mar-18, there is an Ind-AS adjustment of Rs. 85 crores.
Capacity Utilisation: Company keeps on spending for expansion of its fixed assets, whereas its utilised capacity was around 70% -80% (API division was having around 90%), Omkar chemical’s utilised capacity reduced to 60% and then to 21%. in last two years.
Write off / Impairment Loss: In Mar-17 company has written off capital work in progress (CWIP) to the tune of Rs. 176 crs (though in Mar-17 balance sheet CWIP deletion was Rs. 201 crs which included transfer to API division on demerger) & in Mar-18 there was an addition of Rs. 55 crs in CWIP and subsequently booked as an impairment loss in the same year itself.
Transfer on account of Demerger: Mar-17 financial include impact of merger/demerger, in fixed assets schedule it was shown that Rs. 29 crs is transferred to Lasa Supergenre Ltd on account of merger/demerger, whereas as per the Lasa Supergenre balance sheet (Mar-17) book value of fixed asset transferred is Rs. 131 crs (including CWIP of Rs. 22.8 crs).
Merger/demerger impact and revaluation of Fixed Assets
The Board of Directors of Bayer CropScience Limited and Monsanto India Limited, at its Meeting held inter alia, has considered the amalgamation of Monsanto India Limited with Bayer CropScience Limited. Bayer , a German stock corporation, is a life sciences company with core competencies in the areas of health care and agriculture. The activities of Bayer have carried out in three divisions i.e. pharmaceuticals; consumer health; and crop sciences. Bayer CropScience Limited (BCL) is the listed Indian arm of Bayer AG engaged in the business of manufacturing, selling, marketing of pesticides and pest control products, distribution of seeds and provision of services in the field of agriculture. Other than BCL, In India, Bayer also operates through various group companies. Monsanto , incorporated in the United States of America, is an agricultural company, which provides seeds, biotechnology traits and crop protection, globally. In addition, Monsanto is active in providing digital ...
Hindustan Unilever outruns Nestle and bags GSK’s nutrition business in its kitty. This being the country’s biggest consumer goods deal is an all equity deal. Hindustan Unilever Ltd (HUL) , incorporated in 1933 and is a subsidiary of Unilever, one of the world's leading suppliers of Food, Home Care, Personal Care and Refreshment products. Unilever has over 67% shareholding in HUL. HUL is India's largest fast-moving consumer goods company with a heritage of over 80 years in India. HUL operates in four business segments, they are: Personal care includes products in the categories of oral care skin care, soaps, hair care, talcum powder and colour cosmetics. Home Care includes detergent bars detergent powders Foods & Refreshments Water purifier called Pureit The shares of HUL are listed on BSE and NSE and current market cap is ~₹3,86,076 Crores. GlaxoSmithKline Consumer Healthcare Ltd (GSK), is one of the largest players in the Health Food Drinks industry in India...
Alembic Ltd (Alembic), incorporated in 1907, is part of Alembic group and it is engaged in the business of manufacturing and trading active pharmaceutical ingredients (API) and Real Estate Developments. It also has investment in Alembic Pharmaceuticals Limited (APL). Shreno Limited (Shreno), incorporated in 1944, is engaged in the business of manufacturing and trading of glassware items, machinery and equipments (engineering) required for various industries, making investments and real estate developments. Nirayu Pvt. Ltd. (Nirayu), incorporated in 1971, is currently holding investment in shares and securities of various entities. Current Shareholding of the companies Please Note: 1% OCPS of Shreno limited of book value Rs. 8.71 crores were converted in equity shares by alembic Limited in FY 2018 Therefore the final total investment by Alembic in equity is Rs. 35.13 crores. Alembic acquired 55% stake in Alembic City Limited resulting into WOS of the company ...


Comments
Post a Comment